Zinnia
UAE > Dubai > Damac Hills 2 (Akoya Oxygen) > Middle Circle (D2) > Zinnia
Media
Construction Status
100%
Payment Plan
60/40
Anticipated Completion Date
02-Jun-2022
60/40
| Description | Milestone Event | (%) Value |
|---|---|---|
| Down Payment | Immediate | 20% |
| 1st Installment | Within 0 Months of Sale Date (Easy installments) | 40% |
| Payment At Handover | On Completion | 40% |
Details
Title :
Zinnia
Type :
Free Hold
Project Number :
1595
Completion Status :
Completed/Ready
Life Cycle :
Mature
Master Development :
Middle Circle (D2)
Developer :
Plot Number :
91421324
Project Configuration :
G+1,G+2
Number Of Units :
487
Number Of Floor :
3
Plot Area :
2,099 Square Feet
Built Up Area :
90,997 Square Meter
Construction Status :
100%
Launch Date :
01-Oct-2014
Registration Date :
19-Oct-2014
Construction Started Date :
01-Apr-2015
Anticipated Completion Date :
02-Jun-2022
Cost Consultants :
N/A
Piling Contractors :
N/A
Handover Date :
31-Oct-2021
Main Contractors :
N/A
Sub Contractors :
N/A
Architects :
N/A
MEP Contractors :
N/A
Project Managers :
N/A
Description
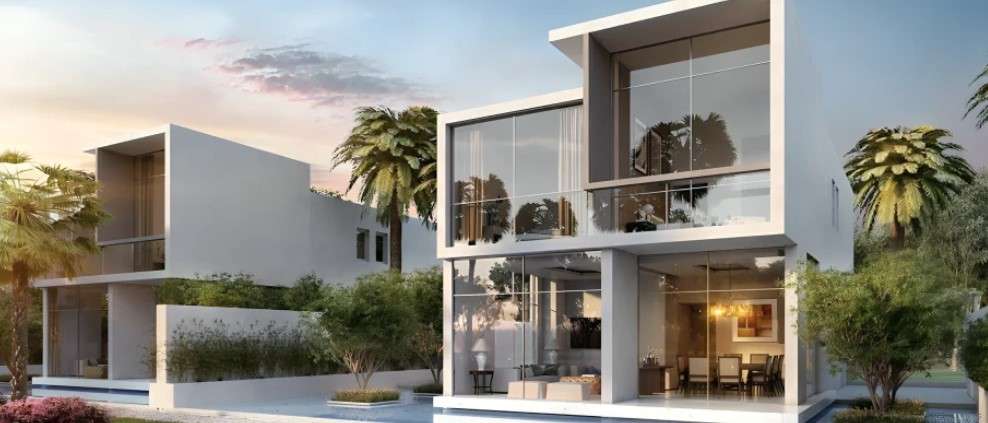
Zinnia at DAMAC Hills 2 – Modern Living in a Serene Gated Community
Zinnia is a beautifully crafted sub-community within DAMAC Hills 2, developed by DAMAC Properties and strategically located near Jebel Ali–Lehbab Road (E77). This gated enclave offers a harmonious blend of luxury, comfort, and connectivity in a peaceful suburban setting.
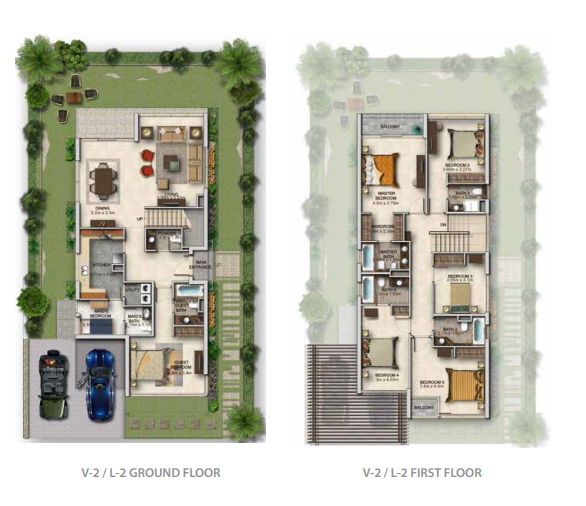
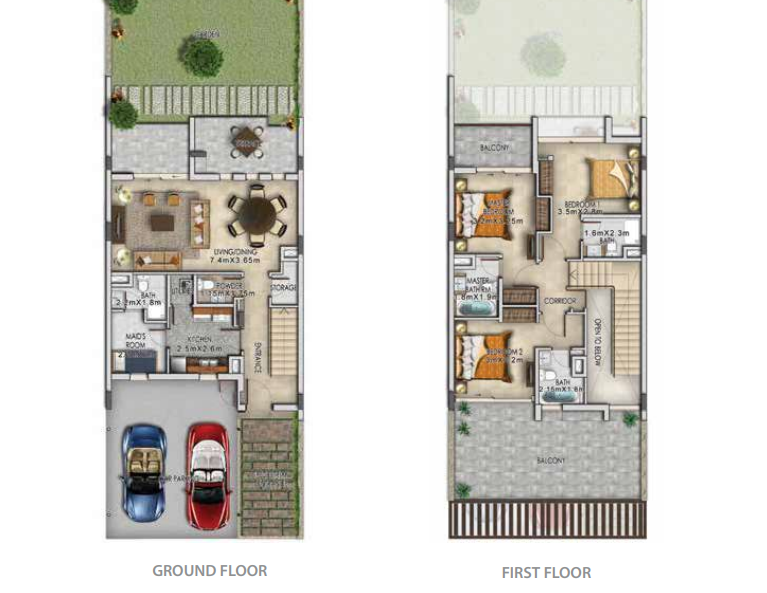
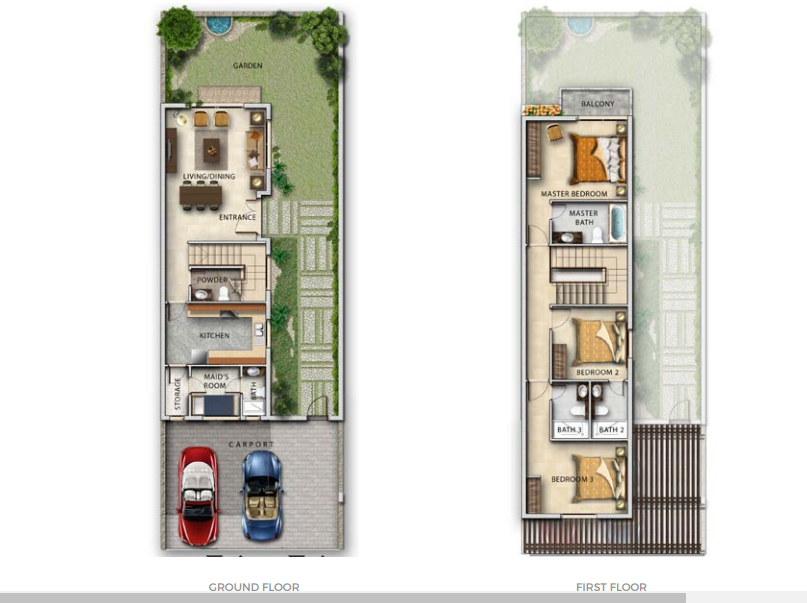
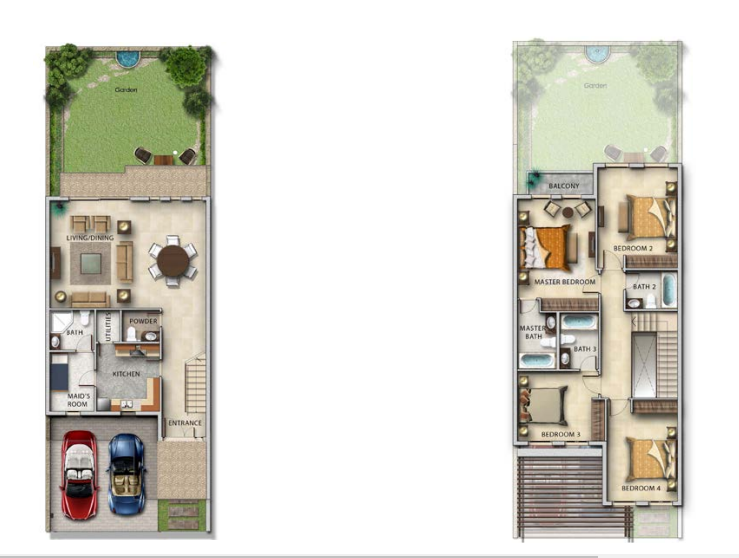
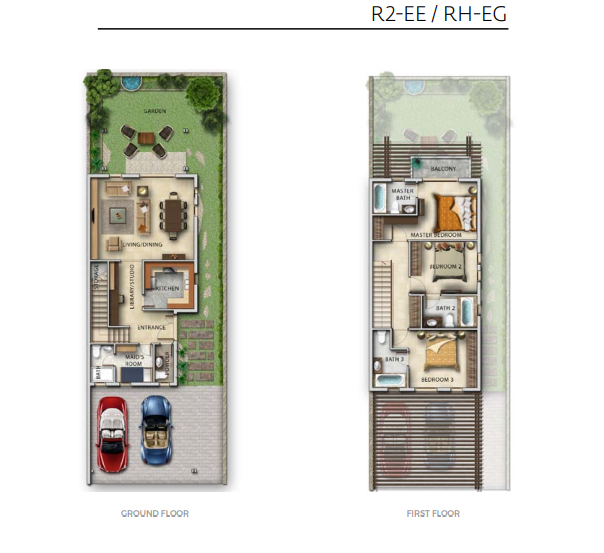
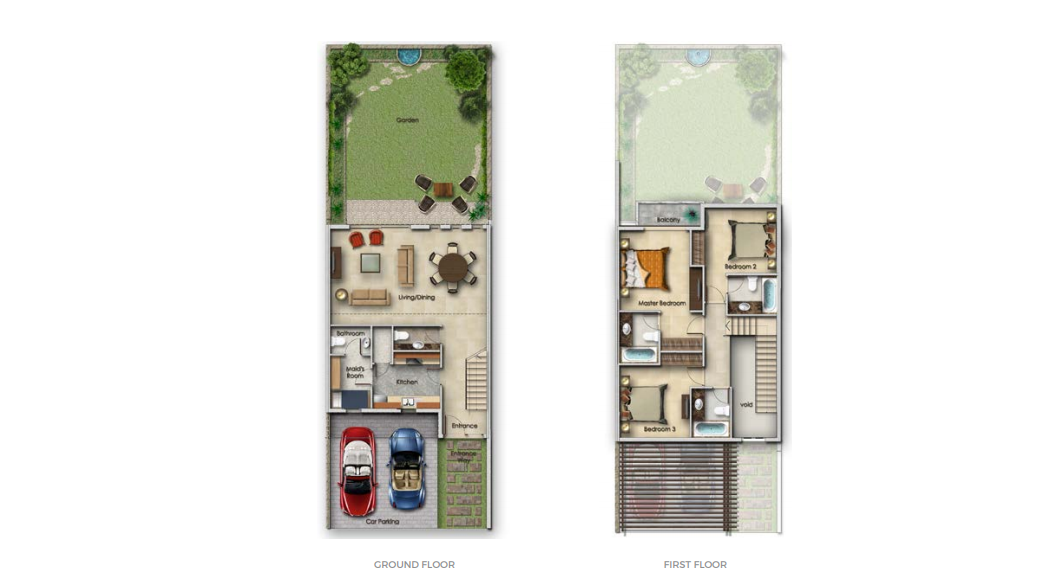
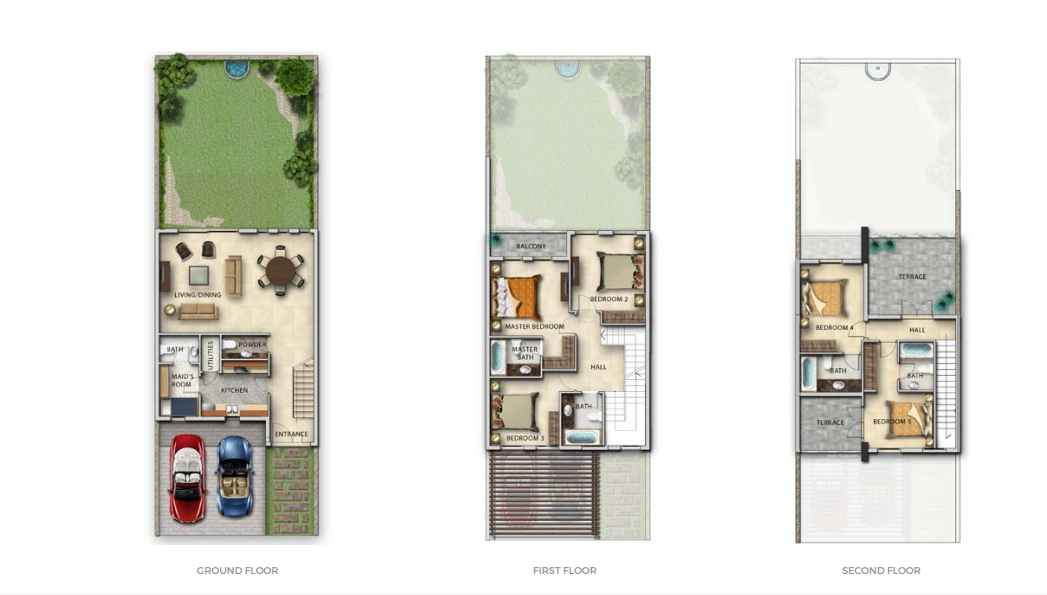
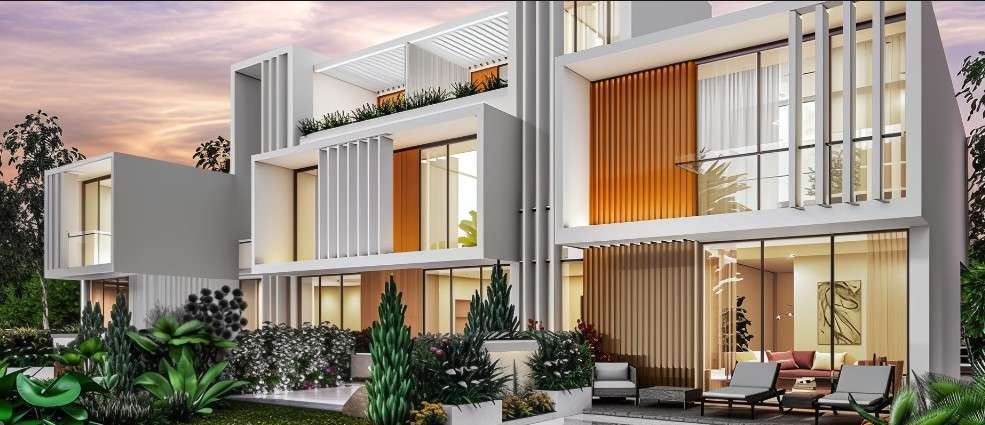
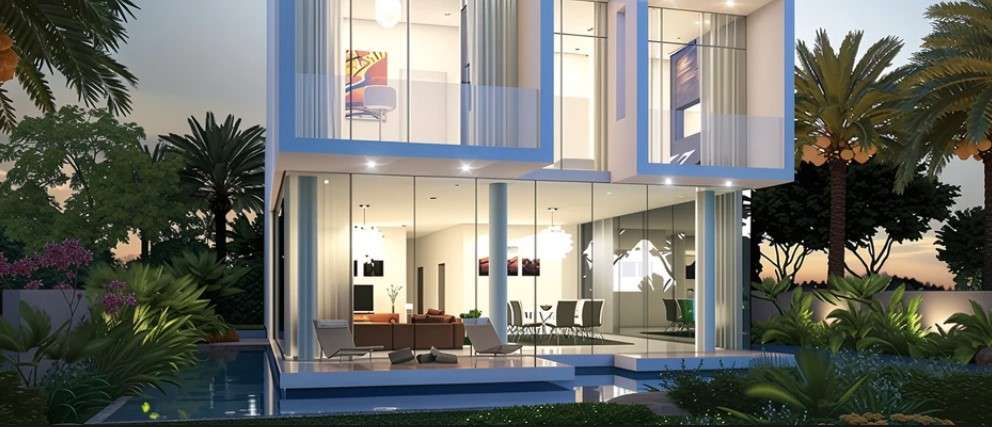
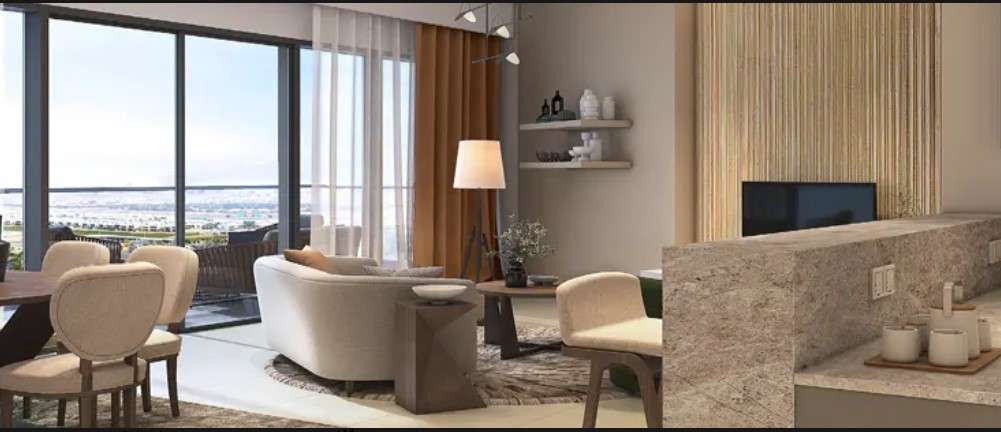
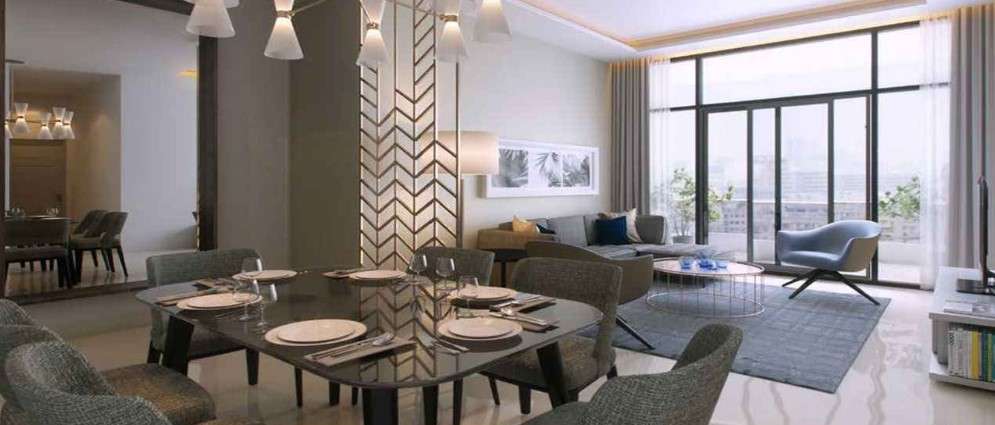
Launched in 2015 and completed in 2022, Zinnia features a stunning collection of premium villas and townhouses ranging from 3 to 6 bedrooms, with spacious layouts starting from 1,700 sq. ft. Each home showcases contemporary architecture, panoramic windows, and pastel-toned interiors, creating bright, elegant spaces designed to maximize natural light and promote a relaxing ambiance.
The residences come fully furnished and thoughtfully designed for both families and professionals, emphasizing privacy and modern convenience. Residents of Zinnia enjoy access to lush green landscapes, parks, walking trails, and a wide range of world-class amenities within the greater DAMAC Hills 2 community — including sports facilities, swimming pools, retail outlets, and leisure areas.
With its tranquil atmosphere, secure environment, and excellent connectivity to key Dubai destinations, Zinnia at DAMAC Hills 2 offers a refined suburban lifestyle that perfectly balances serenity, comfort, and accessibility — making it one of the most desirable addresses for contemporary living in Dubai.
Location
| Title | Action |
|---|---|
| V-2 | View Details |
| R2-MB | View Details |
| RH-MG | View Details |
| R2-M1/RH-M4 | View Details |
| R2-EE/RH-EG | View Details |
| RH-M/R2-M | View Details |
| R3-M | View Details |