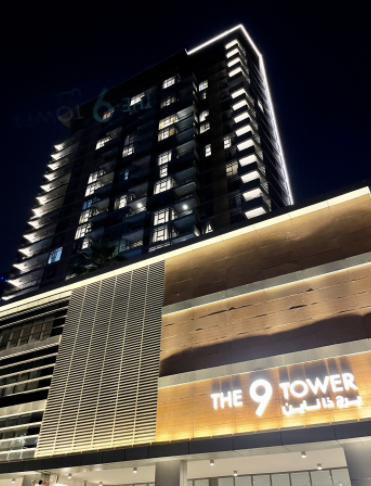
The 9 Tower
UAE > Dubai > Business Bay > Zone A > A03 > The 9 Tower


Construction Status
100%
Payment Plan
Pay 100%
Anticipated Completion Date
01-Jan-2020
Pay 100%
| Description | Milestone Event | (%) Value |
|---|---|---|
| Down Payment | Immediate | 100% |
Details
Title :
The 9 Tower
Type :
Free Hold
Project Number :
N/A
Completion Status :
Completed/Ready
Life Cycle :
Mature
Master Development :
A03
Developer :
Plot Number :
BB.A03.040
Project Configuration :
G+3P+21
Number Of Units :
174
Number Of Floor :
21
Plot Area :
50,526 Square Feet
Built Up Area :
N/A
Construction Status :
100%
Launch Date :
N/A
Registration Date :
N/A
Construction Started Date :
01-Jan-2015
Anticipated Completion Date :
01-Jan-2020
Cost Consultants :
N/A
Piling Contractors :
N/A
Handover Date :
N/A
Main Contractors :
Ginco General Contracting
Sub Contractors :
N/A
Architects :
N/A
MEP Contractors :
N/A
Project Managers :
N/A
Special Classifications
Road Locations
Views
Description
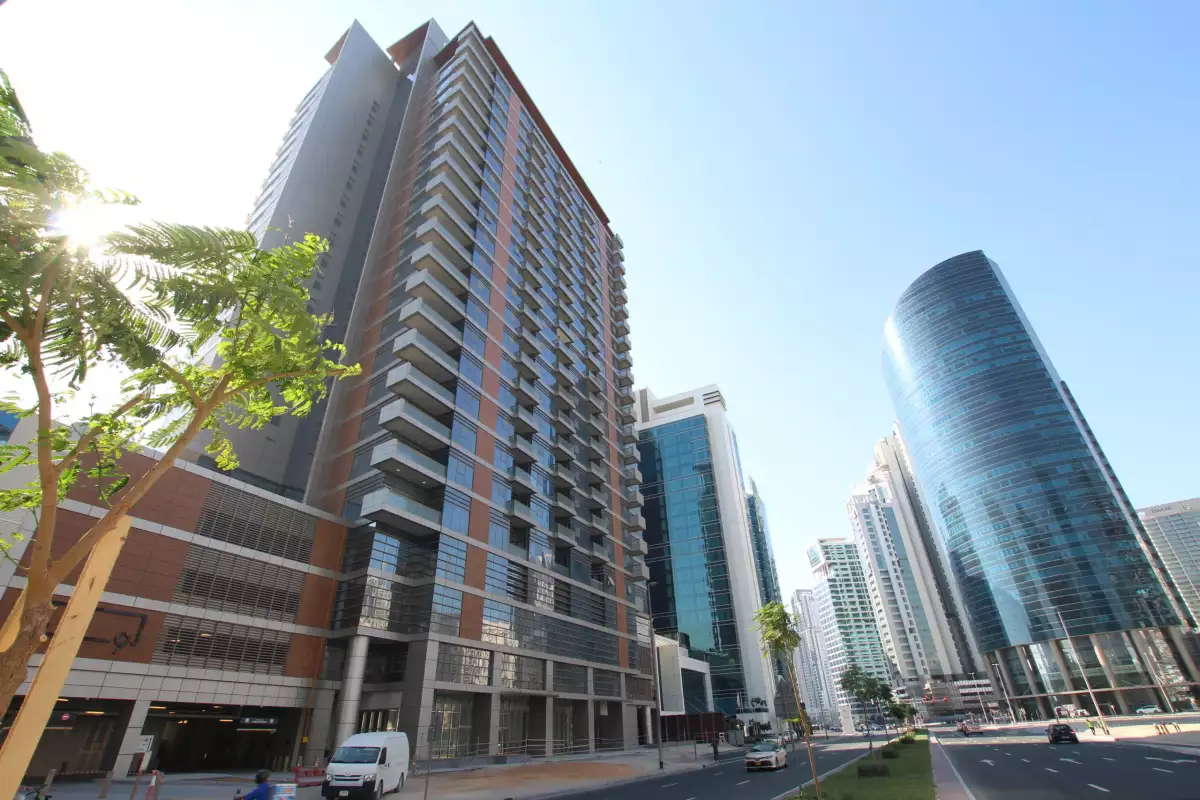
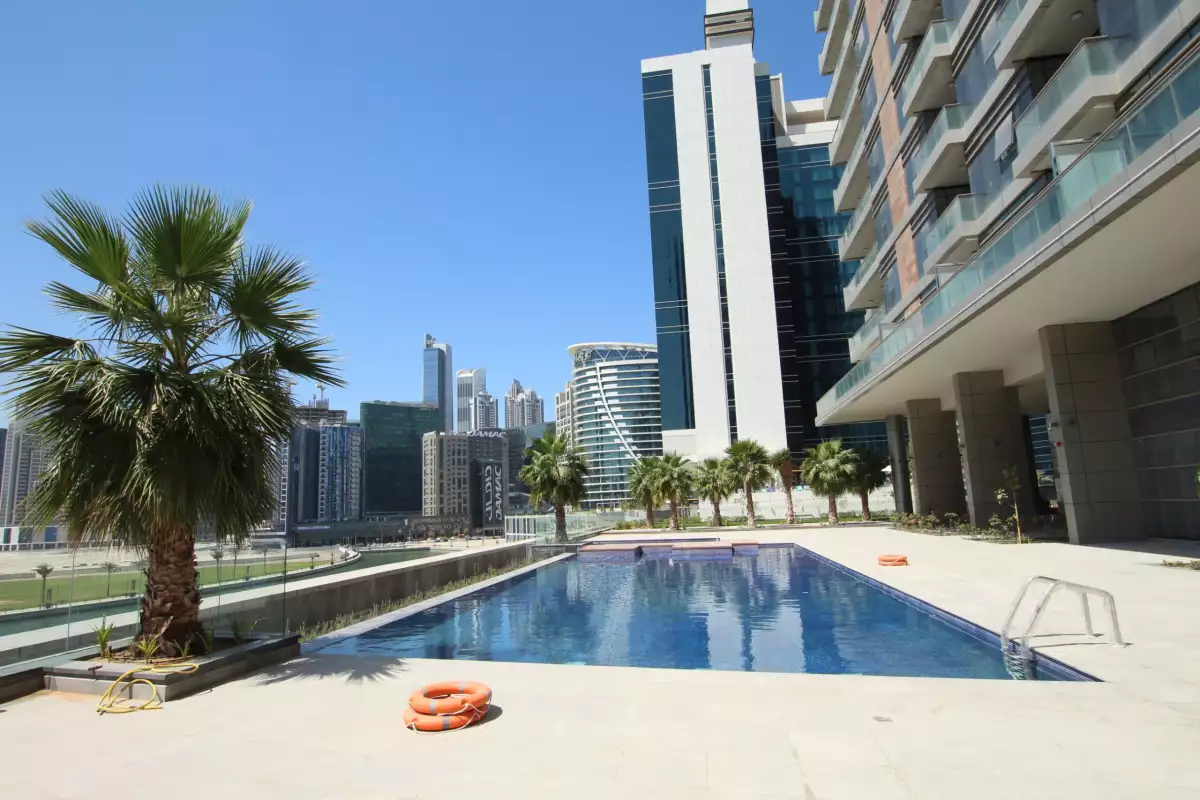
The 9 is a 21-story mixed-use building in Business Bay, Dubai. The project was developed by Mr. Gheyath Mohammed Gheyath.
IN A NUTSHELL
- Freehold Mixed-use Building
- Located in the heart of Business Bay
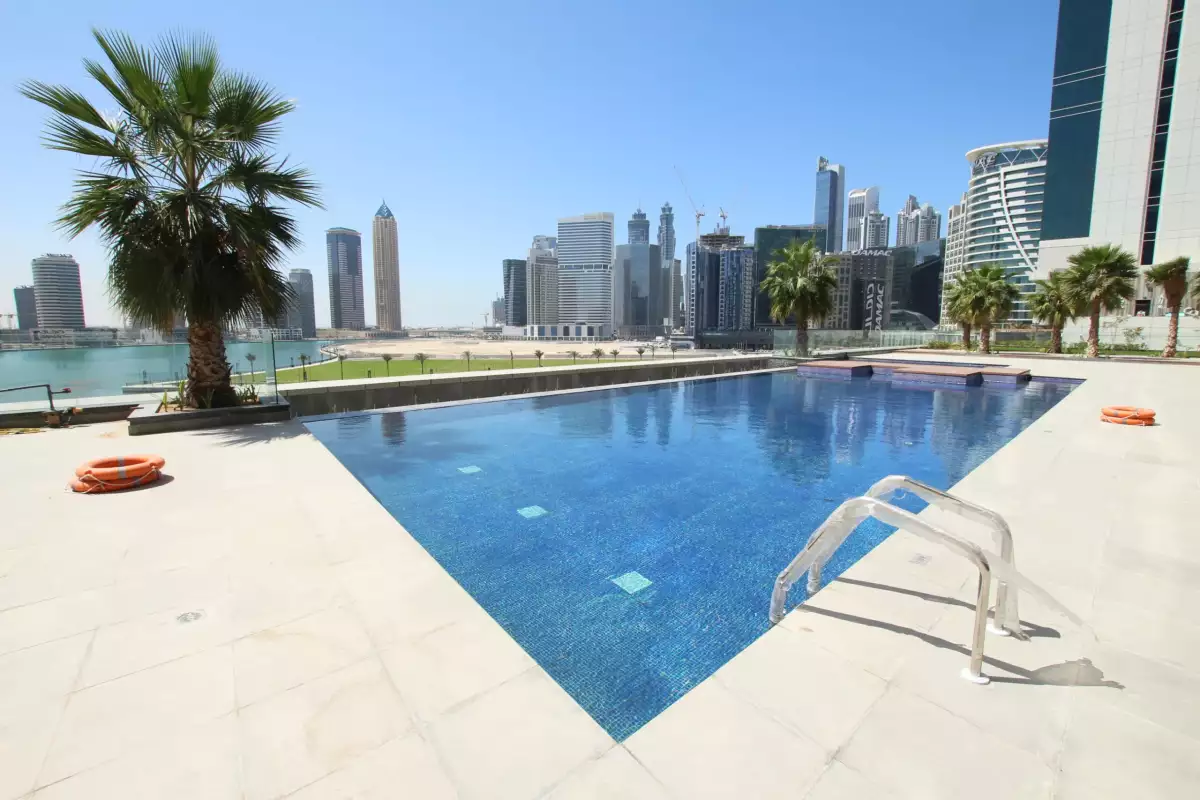
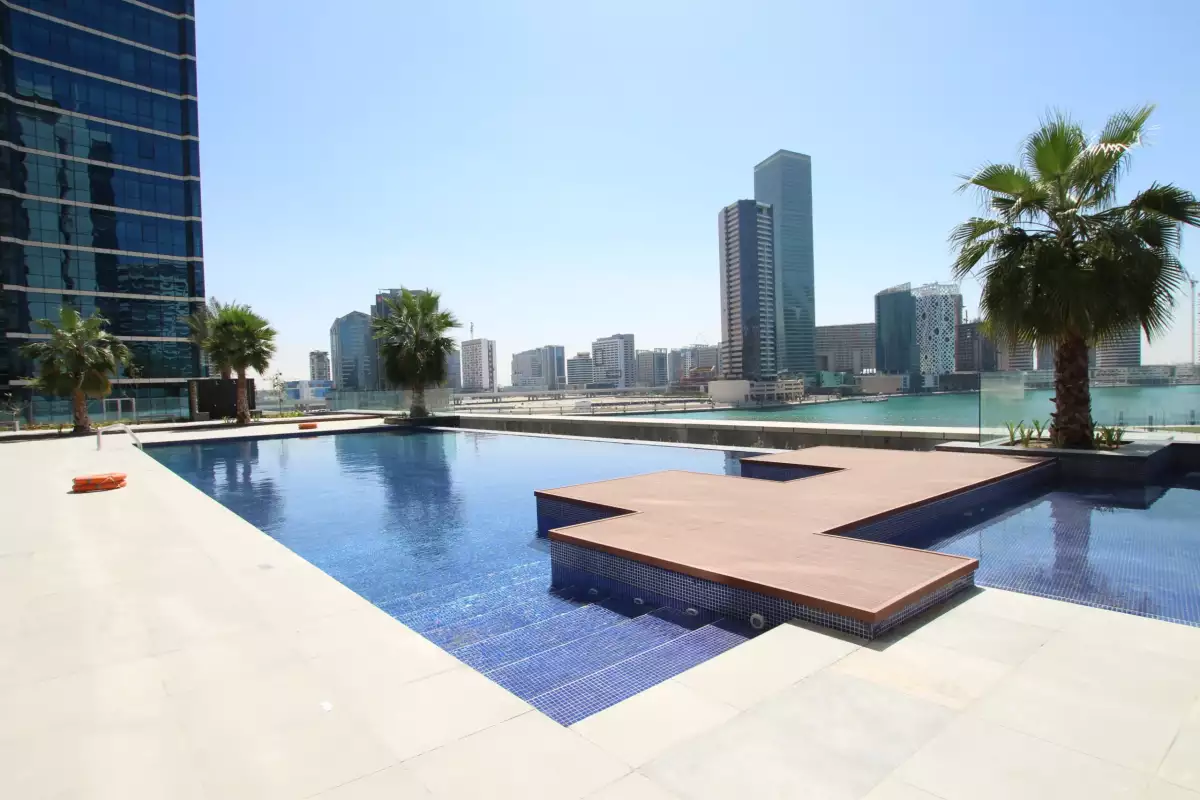
- The mixed-use building is located directly on the Dubai Water Canal
- This freehold property has 1- and 2-bedroom apartments on the higher floors and retail options on the ground level
- 1-bedroom apartments in The 9 Tower Business Bay Dubai cover 870 sq. ft. to 956 sq. ft.
- 2-bedroom apartments in The 9 Tower Business Bay Dubai have a covered area of 1,530 sq. ft.
- One bay for each 70 sq. m. Of total retail GFA.
- One bay for each 50 sq. m. Of total office GFA.
- For hotel one bay for each 5 hotel rooms and 1 bay for each 2 suites and one bay for every 50 sq. m of food and beverage, office and retail areas and one bay for every 20 sq. m of meeting and ballroom hall areas.
- For apartments/hotel apartments, one bay for each unit less than or equal to 150 sq. m and two bays for each unit exceeding 150 sq. m.