MAZAYA 13
UAE > Dubai > Liwan > Queue Point Liwan > Mazaya Buildings > MAZAYA 13
Media

Construction Status
100%
Payment Plan
N/A
Anticipated Completion Date
N/A
Details
Title :
MAZAYA 13
Type :
Free Hold
Project Number :
N/A
Completion Status :
Completed/Ready
Life Cycle :
Mature
Master Development :
Mazaya Buildings
Developer :
N/A
Plot Number :
1325-
Project Configuration :
N/A
Number Of Units :
50
Number Of Floor :
6
Plot Area :
N/A
Built Up Area :
N/A
Construction Status :
100%
Launch Date :
N/A
Registration Date :
N/A
Construction Started Date :
N/A
Anticipated Completion Date :
N/A
Cost Consultants :
N/A
Piling Contractors :
N/A
Handover Date :
N/A
Main Contractors :
N/A
Sub Contractors :
N/A
Architects :
N/A
MEP Contractors :
N/A
Project Managers :
N/A
Special Classifications
Views
Description
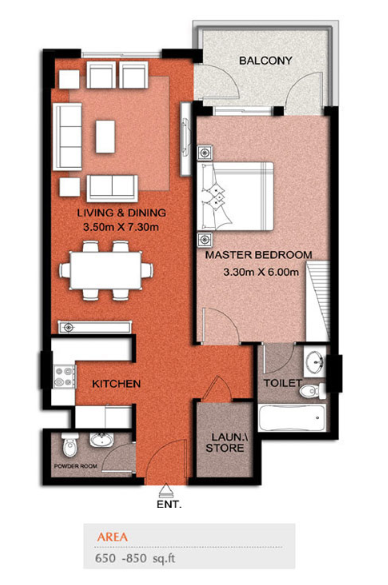
Mazaya 13:
Mazaya 13 is one of the buildings of Mazaya Buildings, Queue Point, Liwan, Dubai
Mazaya 13 is a residential building
Mazaya 13 has 6 floors
Mazaya 13 has 50 units
Mazaya 13 was developed by Al Mazaya Holding
Mazaya 13 has easy access to Sheikh Mohammad Bin Zayed Road and Dubai Al Ain Road
Location
| Title | Floor Level | From | To | Action |
|---|---|---|---|---|
| Mazaya 13 | N/A | N/A | N/A | View Details |
| Title | Action |
|---|---|
| Unit 1 | View Details |
| Unit 2 | View Details |
| Unit 3 | View Details |