Jumeirah Business Centre 4
UAE > Dubai > Jumeirah Lake Towers (JLT) > Cluster N > Jumeirah Business Centre 4
Media
Construction Status
100%
Payment Plan
N/A
Anticipated Completion Date
03-May-2010
Details
Title :
Jumeirah Business Centre 4
Type :
Free Hold
Project Number :
504
Completion Status :
Completed/Ready
Life Cycle :
Mature
Master Development :
Cluster N
Developer :
Plot Number :
N/A
Project Configuration :
N/A
Number Of Units :
258
Number Of Floor :
39
Plot Area :
N/A
Built Up Area :
N/A
Construction Status :
100%
Launch Date :
N/A
Registration Date :
08-Nov-2008
Construction Started Date :
04-Aug-2007
Anticipated Completion Date :
03-May-2010
Cost Consultants :
N/A
Piling Contractors :
N/A
Handover Date :
N/A
Main Contractors :
N/A
Sub Contractors :
N/A
Architects :
N/A
MEP Contractors :
N/A
Project Managers :
N/A
Amenities
Description
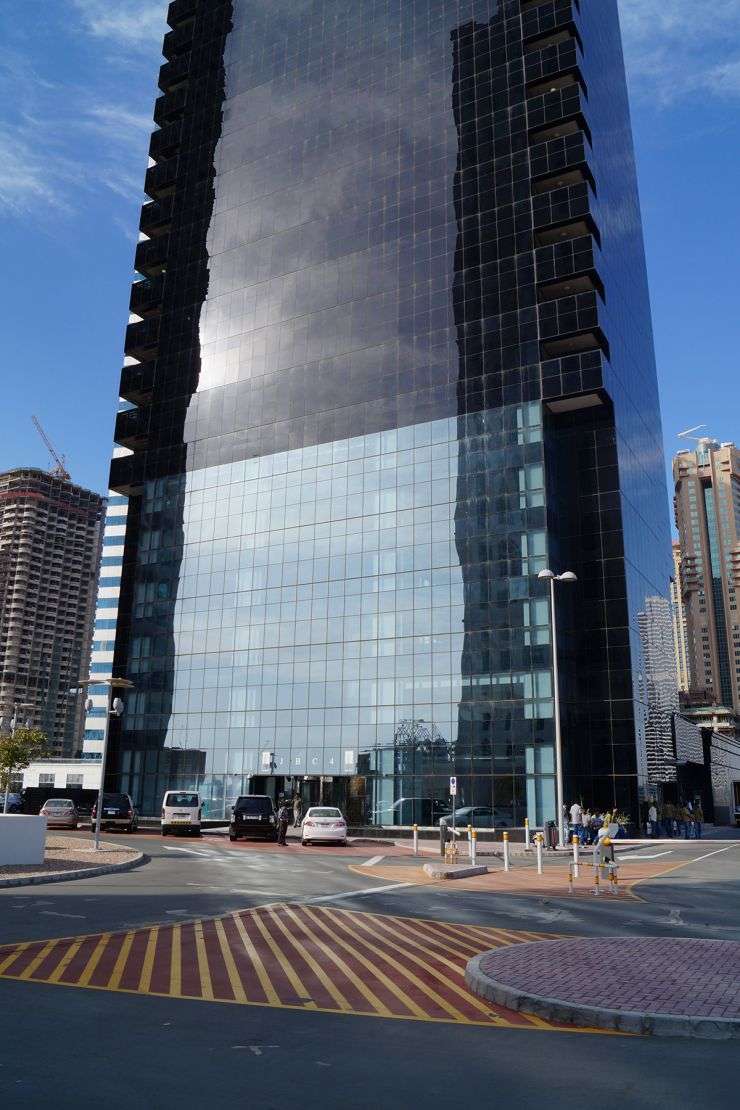
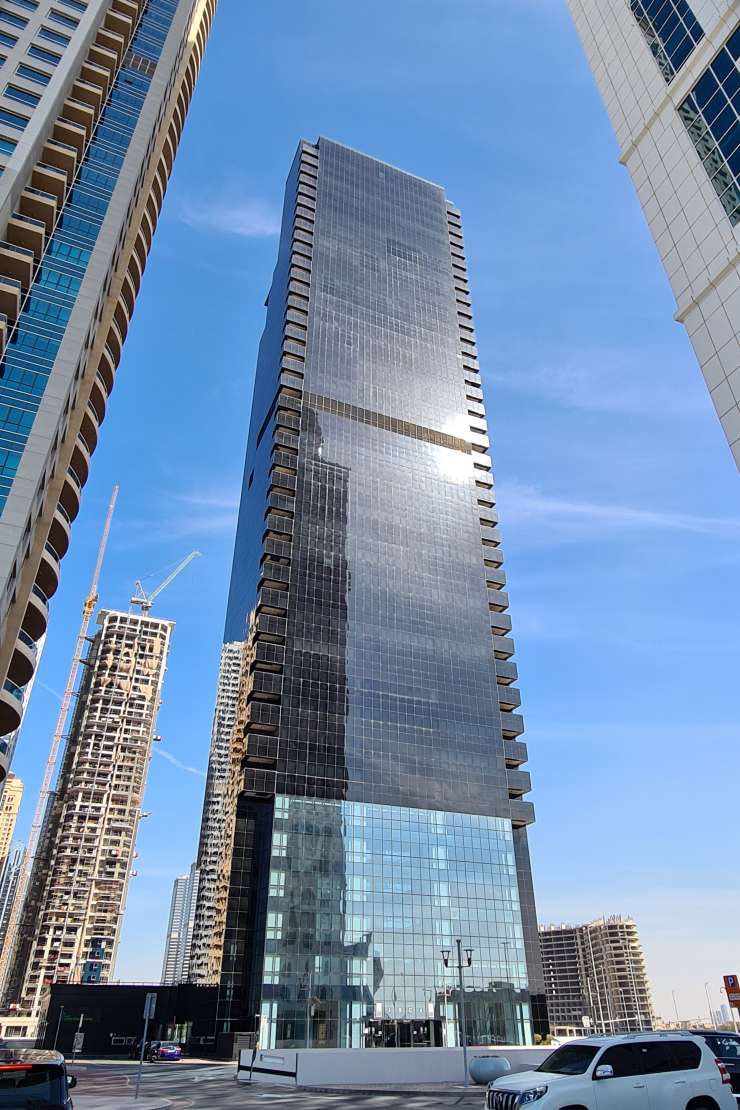
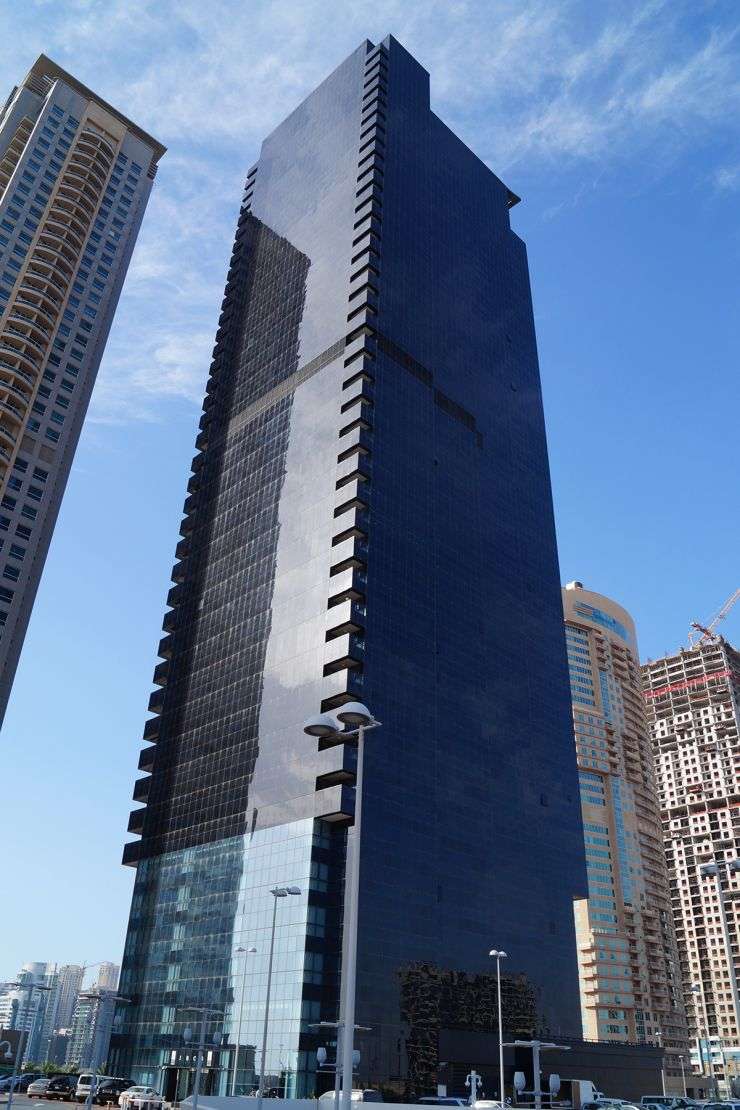
Jumeirah Business Centre 4 is one of the 5 commercial buildings in Jumeirah Business Centre in Jumeirah Lakes Towers (JLT), Dubai. Located in JLT Cluster N, the 39-storey tower offers commercial offices and shops for rent and sale.
Developed by Al Fajer Properties, the building has a 5-storey atrium, a spacious lobby with Italian decor, 24-hour security and smart operating systems. It is situated close to Sheikh Zayed Road (E11) and was completed in 2010.
In a Brief:
- Type of building: Commercial
- Location: Jumeirah Lake Towers (JLT)
- Developer: Al Fajer Group
- Date of completion: 2010
- Number of floors: 39 storeys
- Number of Units: 300 offices and 16 retail stores
- Unit type: Offices and shops
- Type of ownership: Freehold
- Amenities: Covered parking, CCTV camera surveillance and gymnasium