Jumeirah Business Centre 2
UAE > Dubai > Jumeirah Lake Towers (JLT) > Cluster V > Jumeirah Business Centre 2
Media
Construction Status
100%
Payment Plan
N/A
Anticipated Completion Date
N/A
Details
Title :
Jumeirah Business Centre 2
Type :
Free Hold
Project Number :
N/A
Completion Status :
Completed/Ready
Life Cycle :
Mature
Master Development :
Cluster V
Developer :
Plot Number :
N/A
Project Configuration :
N/A
Number Of Units :
295
Number Of Floor :
39
Plot Area :
N/A
Built Up Area :
N/A
Construction Status :
100%
Launch Date :
N/A
Registration Date :
N/A
Construction Started Date :
N/A
Anticipated Completion Date :
N/A
Cost Consultants :
N/A
Piling Contractors :
N/A
Handover Date :
N/A
Main Contractors :
N/A
Sub Contractors :
N/A
Architects :
N/A
MEP Contractors :
N/A
Project Managers :
N/A
Description
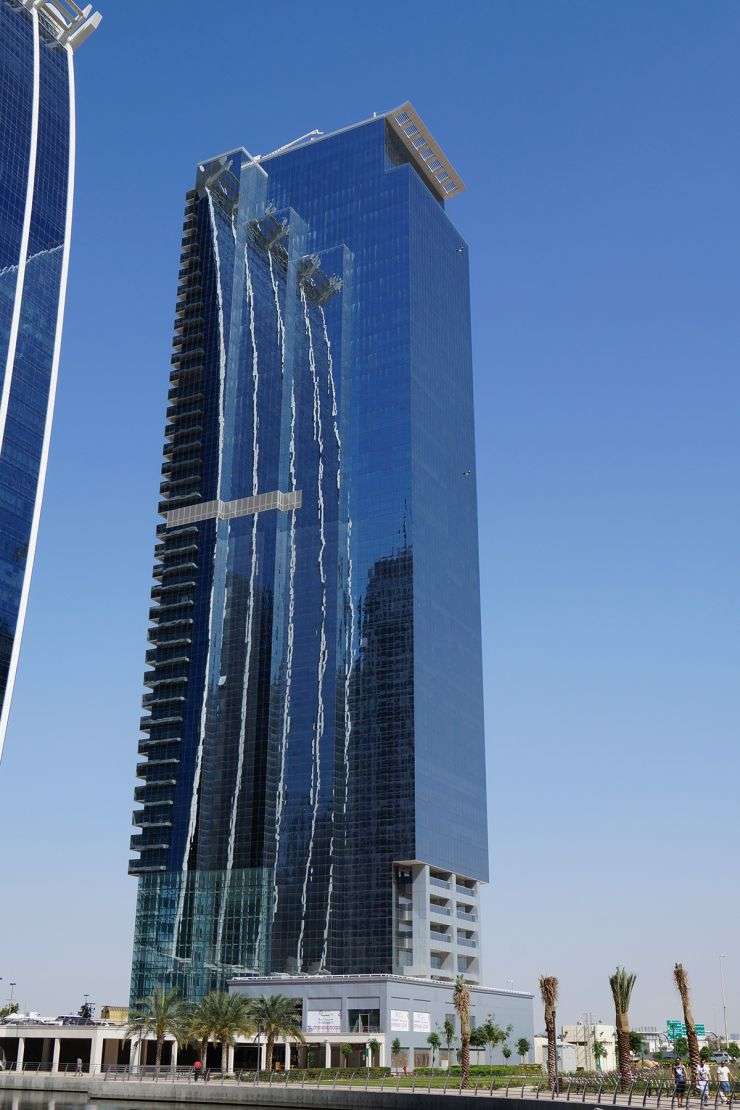
Jumeirah Business Centre 2 is a part of Jumeirah Business Centre located in Jumeirah Lake Towers. This project was developed by Al-Fajar Properties in 2010. Al Fajar Group was established by the group president, His Highness Sheikh Hasher Bin Maktoum Al Maktoum. The ground floor is dedicated to retail outlets and a coffee shop. The tower is also known as JBC 2.
The building offers numerous facilities, including a high-tech security system. Most of the famous eateries and landmarks are located within a distance of a few minutes from the tower.
IN A NUTSHELL
- Project by Al-Fajar Properties
- Located in Cluster V of Jumeirah Lake Towers.
- A part of Jumeirah Business Centre
- A 39-storey skyscraper
- Feature a basement parking area