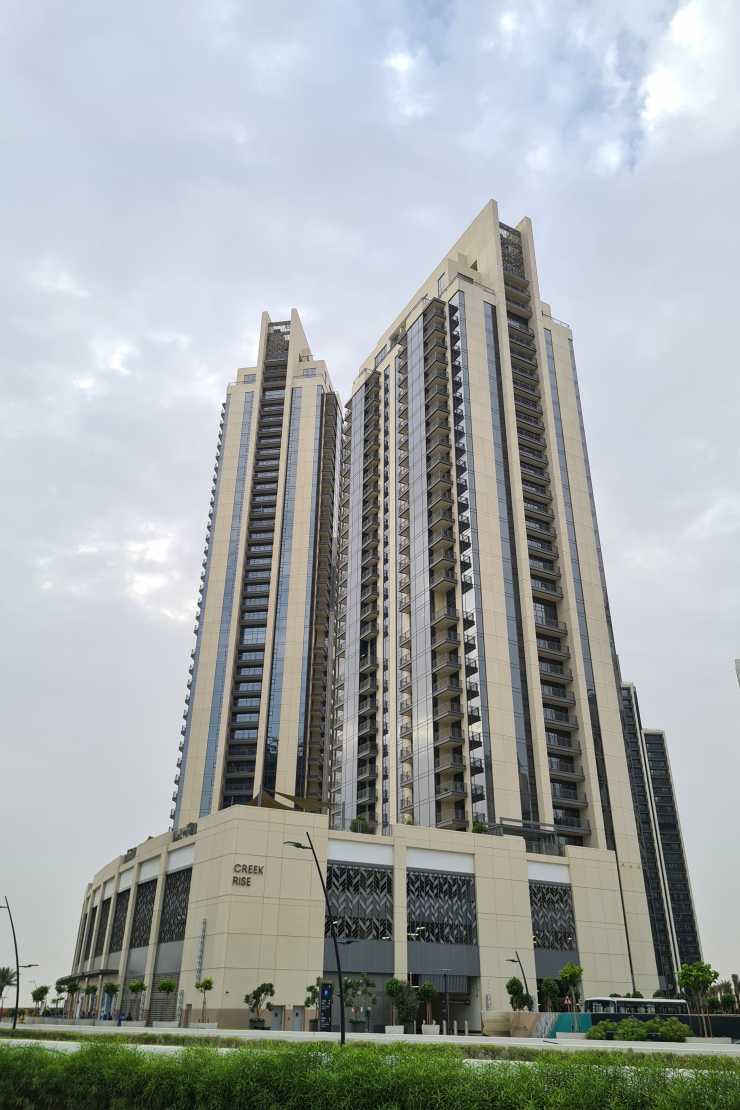
Creek Rise Tower 2
UAE > Dubai > Dubai Creek Harbour > Dubai Creek Harbour Island > Creek Rise > Creek Rise Tower 2

Construction Status
100%
Payment Plan
100% Payment
Anticipated Completion Date
30-Jun-2022
100% Payment
| Description | Milestone Event | (%) Value |
|---|---|---|
| Down Payment | Immediate | 100% |
Details
Title :
Creek Rise Tower 2
Type :
Free Hold
Project Number :
N/A
Completion Status :
Completed/Ready
Life Cycle :
Mature
Master Development :
Creek Rise
Developer :
Plot Number :
4158711
Project Configuration :
N/A
Number Of Units :
238
Number Of Floor :
46
Plot Area :
112,031 Square Meter
Built Up Area :
59,431 Square Feet
Construction Status :
100%
Launch Date :
N/A
Registration Date :
19-Jan-2017
Construction Started Date :
17-Apr-2017
Anticipated Completion Date :
30-Jun-2022
Cost Consultants :
N/A
Piling Contractors :
N/A
Handover Date :
N/A
Main Contractors :
N/A
Sub Contractors :
N/A
Architects :
N/A
MEP Contractors :
N/A
Project Managers :
N/A
Amenities
Description
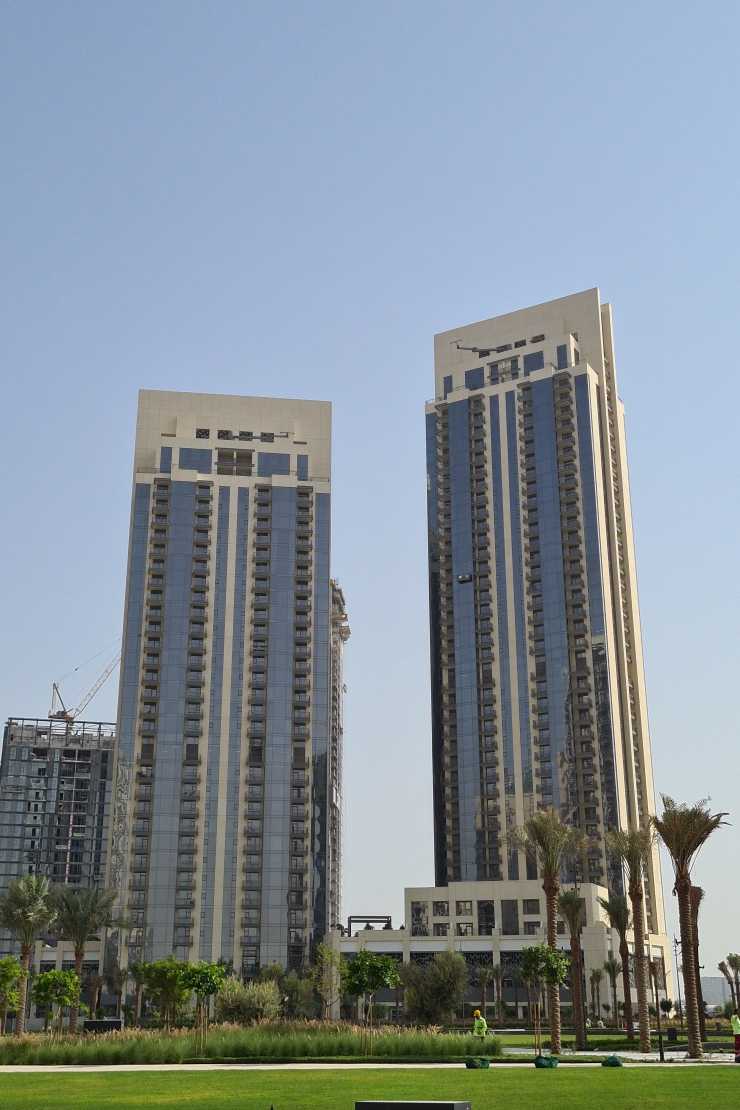
Creek Rise Tower 2
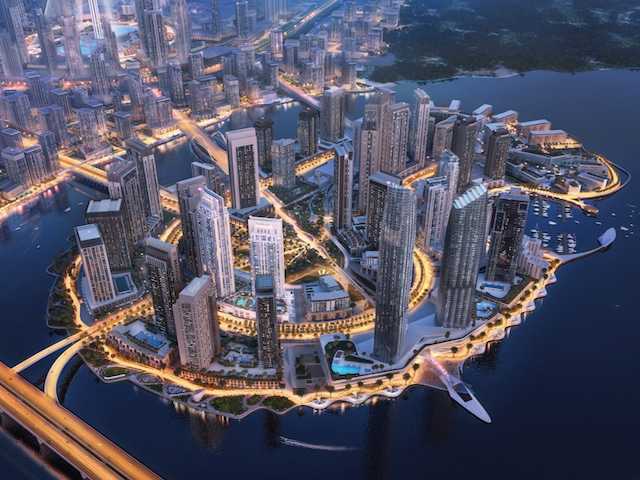
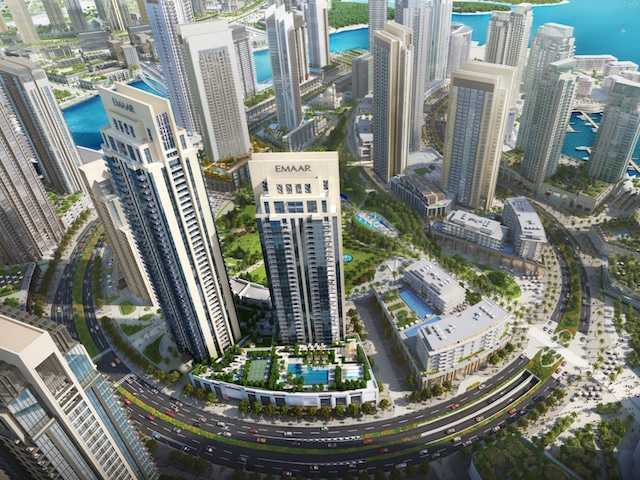
- Creek Rise is the newest project by Emaar. It is a residential development offering 1, 2, and 3-bedroom apartments with ample amenities.
- It is located at Dubai Creek Harbour, which is a mixed-use development offering luxury living and is about a 10-minute drive from Downtown Dubai.
- Dubai Creek Harbour is situated on the banks of the historic Dubai Creek.
Highlights
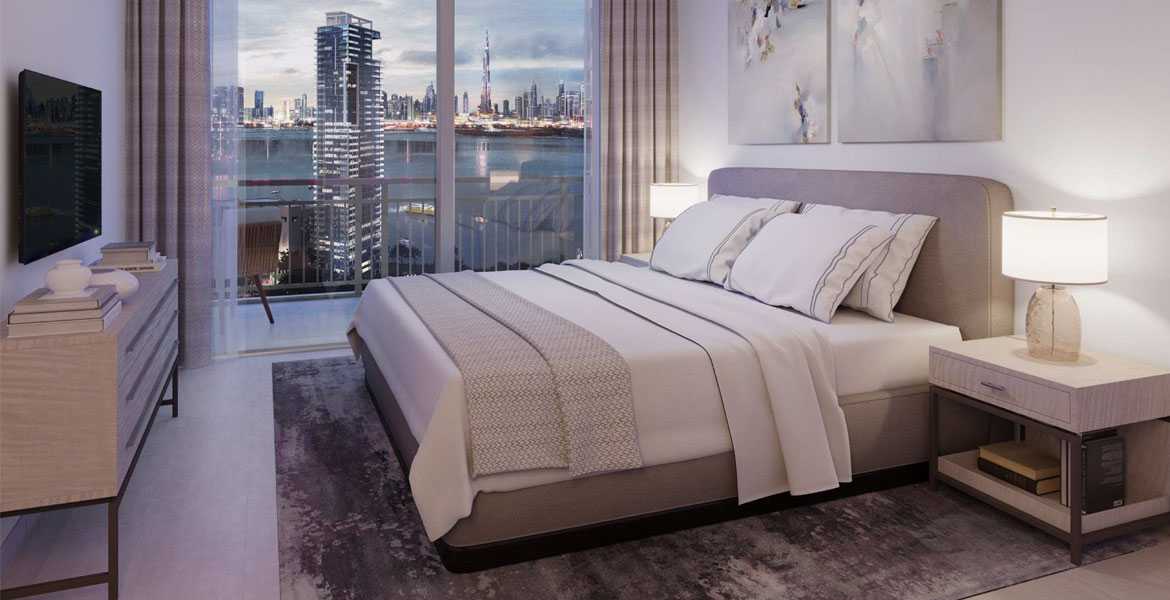
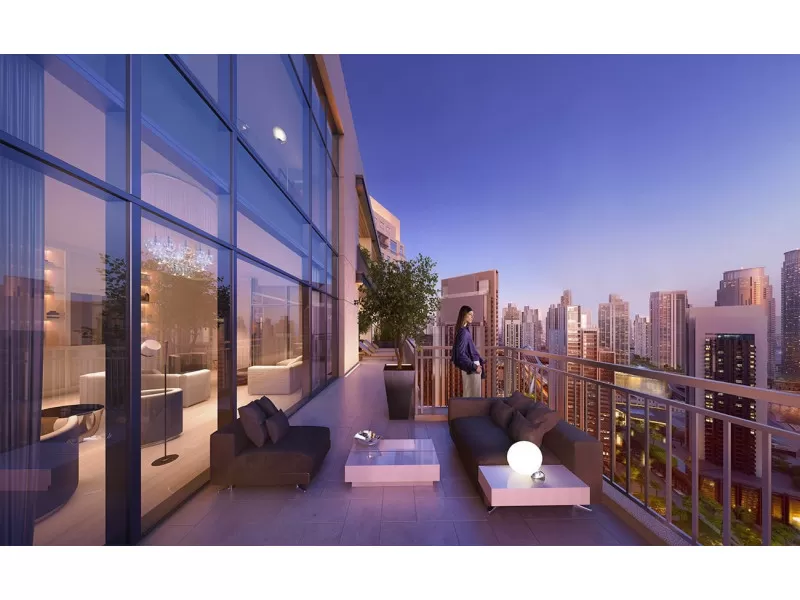
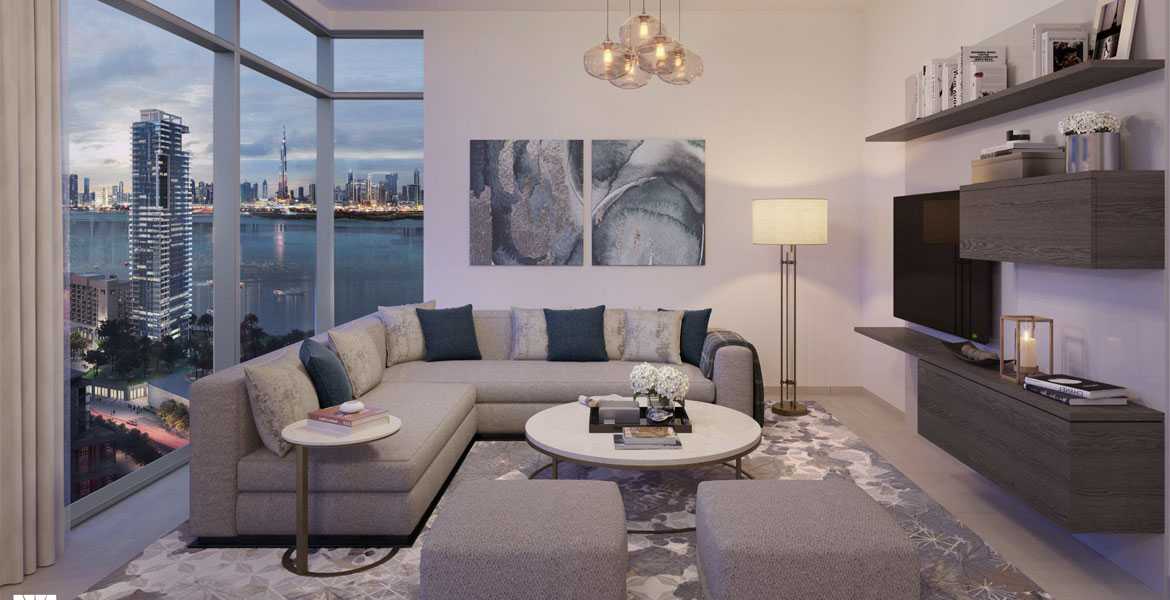
- Stylish apartments
- Modern designs, floor-to-ceiling windows with exceptional views
- Spectacular Views of the Dubai Skyline, Creek & The Tower
- Situated on the Island District at Dubai Creek Harbour
Facilities and Amenities:
- Private Parking
- Excellent Dining Options
- Retail Outlets
- Cafes and Restaurants
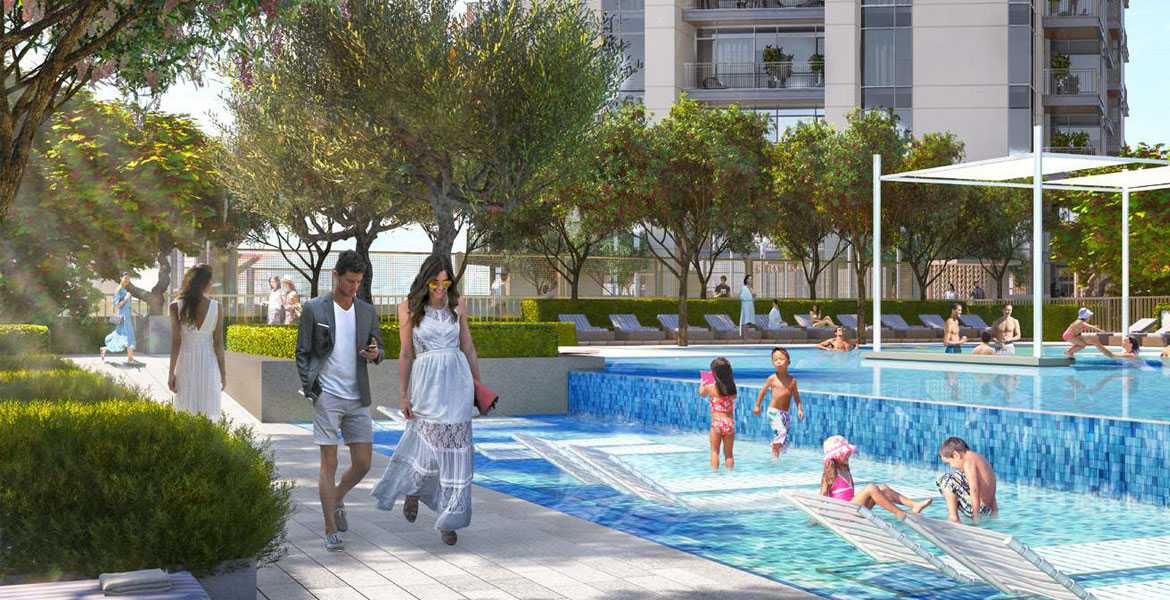
- Public Park
- Supermarket
- Gym
- Swimming Pool.